Product demo
What it is
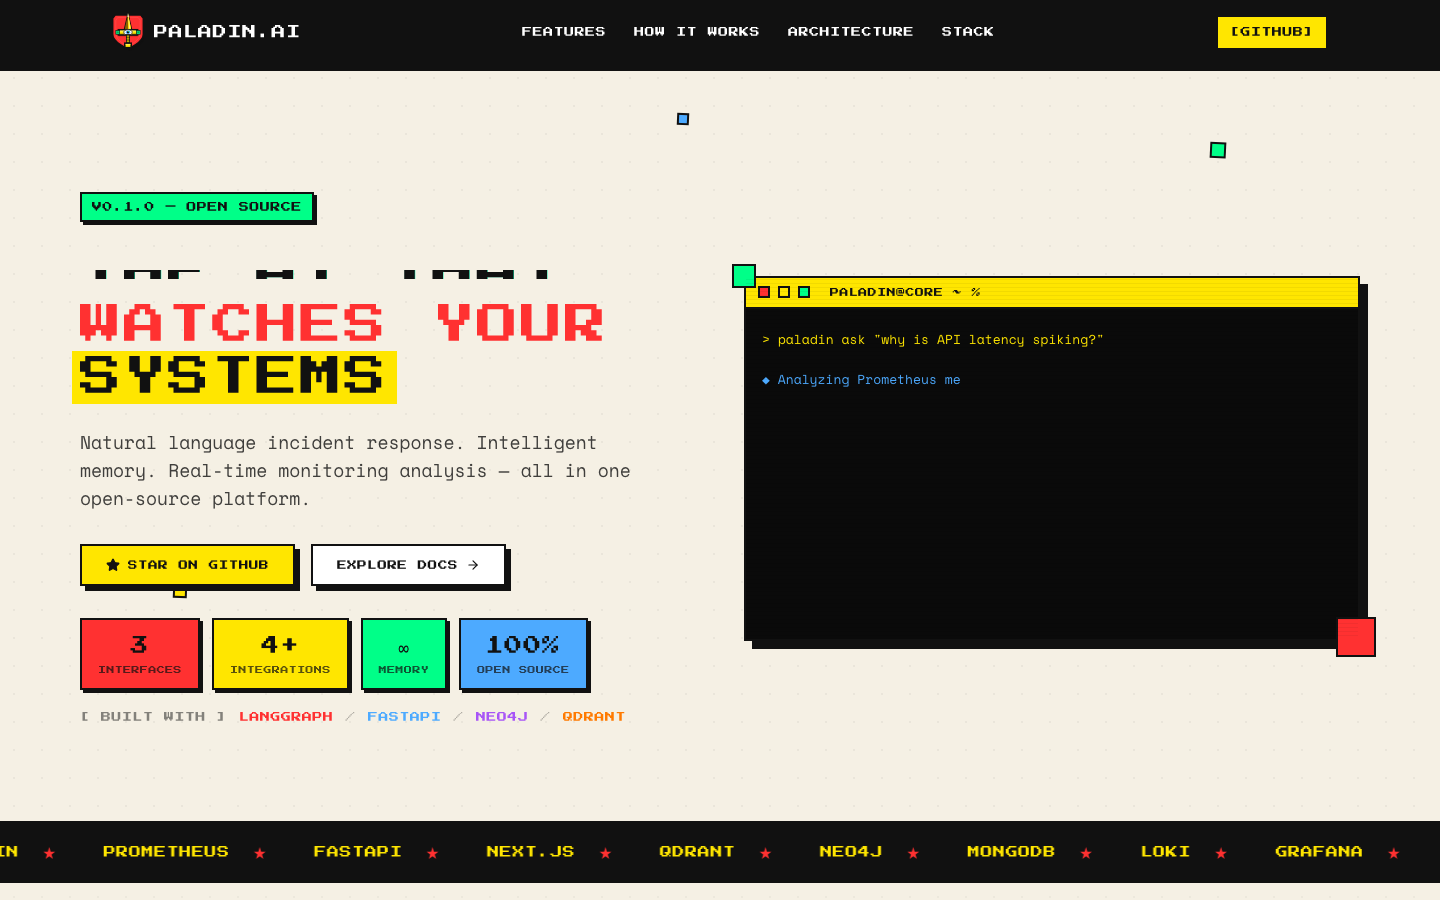
PaladinAI is an open-source incident response platform for asking operational questions in plain English. The product positioning from the landing page is direct: natural-language incident response, intelligent memory, and real-time monitoring analysis in one platform.
The system is built around three access paths: Web UI, CLI, and API. Under the hood, it connects to Prometheus metrics, Loki logs, Grafana dashboards, and Alertmanager rules, then stores findings in Neo4j and Qdrant so incident context survives beyond a single chat.
What I built
- Built the monitoring and incident analysis flow around Prometheus, Grafana, Loki, and Alertmanager.
- Designed the agent workflow with LangGraph, LangChain, OpenAI, and memory layers.
- Added graph and vector-backed context using Neo4j, Qdrant, MongoDB, and Mem0AI.
- Shipped multiple interfaces so the same incident engine could be used from Web UI, CLI, and API.
Why it matters
Operational debugging usually breaks across too many tools: metrics in one place, logs in another, dashboards elsewhere, and tribal knowledge in someone’s head. PaladinAI turns that into a single investigation surface that can query, remember, and explain the system state.